Using Intel VTune on Cloudlab machines
02 Aug 2023Intel VTune Profiler is a tool for analyzing the performance of an application/system. VTune has a myriad of analysis options – hotspots, architectural bottlenecks, memory bandwidth measurement and so on. For a general primer on VTune, please refer to the VTune documentation.
We have used VTune extensively to optimize our high-performance hashtable.
VTune offers both command line and GUI features. However, most of our development is done on cloudlab infrastructure and we typically use a remote VTune setup, where a collector collects all the data on the remote cloudlab node and displays it locally on a nice GUI.
One of the frequent problems we have seen with some versions is the inability
to start microarchitectural exploration due to sep driver not being
loaded/installed properly on the remote node, which seem to have disappeared
with the latest version.
Installation
Typical setup involves installing a VTune profiler on the local machine and connecting through ssh to the remote host where the application we want to profile runs. I have tested this setup on a MacBook Pro (M2) running MacOS v13.4.1 (c). However, the same steps should work on a Linux machine as well.
- Download the VTune standalone version (based on the local node’s OS)
- For MacOS, this is the latest version (at the time of writing)
wget https://registrationcenter-download.intel.com/akdlm/IRC_NAS/99795f2e-81d5-4329-a471-72daa0ce35d7/m_oneapi_vtune_p_2023.2.0.49484.dmg- Follow the instructions by launching the installer
- For Linux, here is the script from the official
page
wget https://registrationcenter-download.intel.com/akdlm/IRC_NAS/dfae6f23-6c90-4b9f-80e2-fa2a5037fe36/l_oneapi_vtune_p_2023.2.0.49485.sh
sudo sh ./l_oneapi_vtune_p_2023.2.0.49485.sh
- For MacOS, this is the latest version (at the time of writing)
Running
-
After installation, one can launch the
vtune-guito start the VTune profiler. -
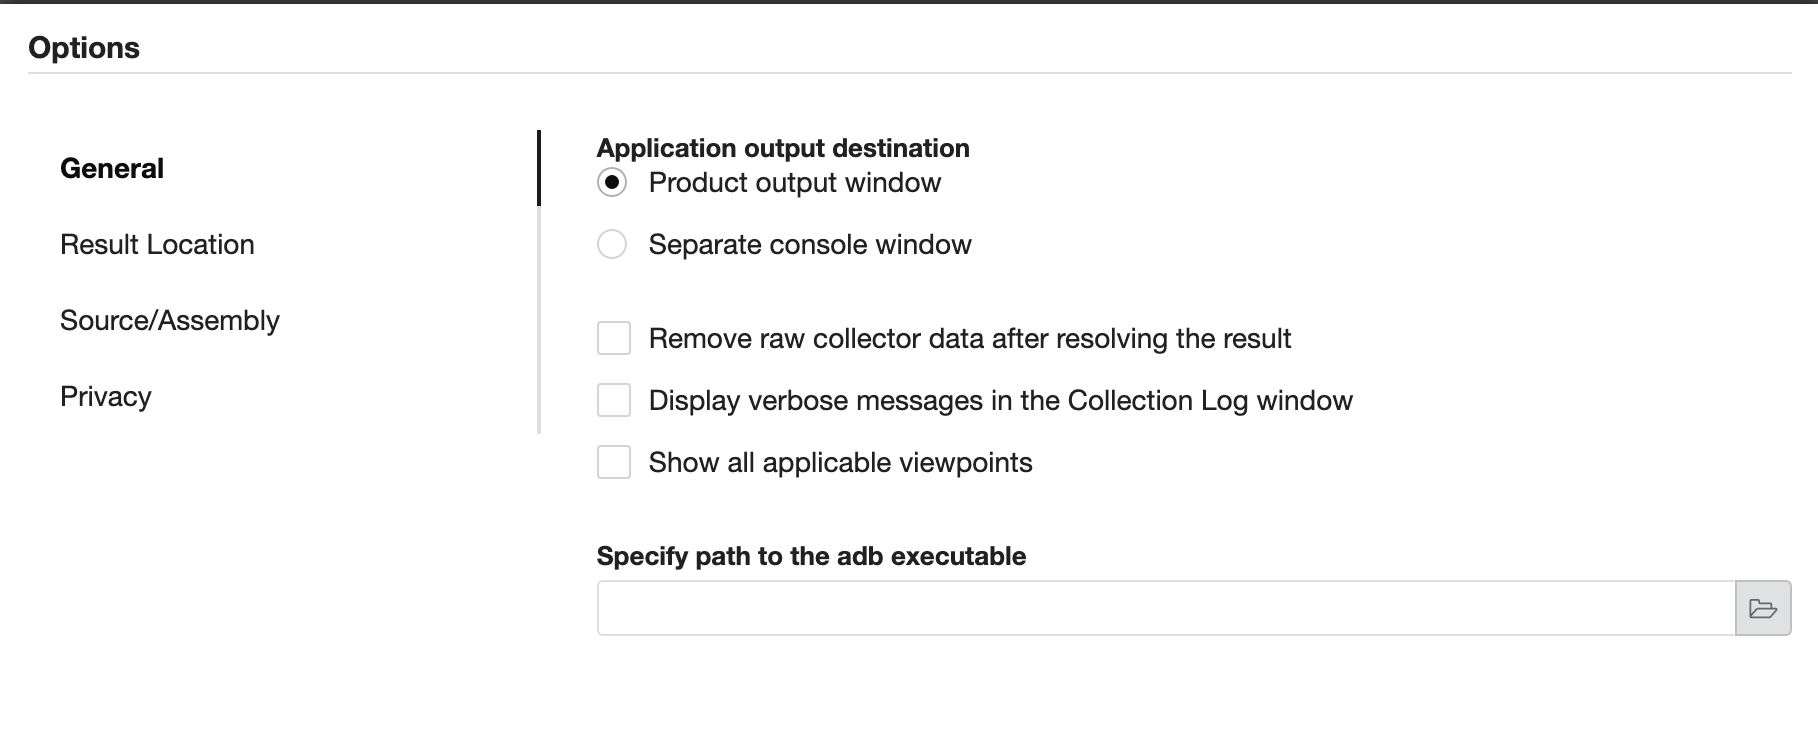
Select “Application output destination” to
Product Output Windowin the settings to see the application output.
- In the “Configure Analysis” tab pick the Remote Linux (SSH) option and
key in the destination in the ssh format.
user@host-
Along with this, pick the desination path for the “remote installation directory”
-
Under the “Launch application” pane, enter the application and command line args that you want to profile.
-
Using the VTune API
The above setup is sufficient for normal profiling. However, if you want to use the VTune API to insert profiling markers on your application or to control when to start/stop profiling from the application itself, you need a full installation on the remote node as well that contains the necessary header files and libraries. Follow the same installation steps for installing VTune on the remote Linux machine. More details on how to use the API is available on their official documentation.